
You invest a lot in your website, review activity reports to see how that investment is doing.
But, when was the last time you improved your website because of something you noticed in your website analytics?
All too often we glance at our website metrics, notice numbers go up and down, and just…move on. Traditional reports often bury insights, leaving you wondering: “What’s broken? How do I fix it?”
Here’s the good news: These 3 actionable reports get straight to the point and show you exactly where to make changes that drive immediate results.
1. Landing Page Leaks: Stop Visitors From Bouncing
Imagine a leaky bucket that never holds water. It’s like the way visitors can land on your website but somehow seem to disappear. How can you ‘fix the leaks’ and keep them around?
The Landing Page Report exposes these leaks. You’ll see:
- Visitor Flow: Do they vanish after the landing page, or explore further?
- Campaign Performance: Which marketing channels bring engaged visitors?
With this information, you can:
- Patch the Leaks: Refine landing pages to keep visitors engaged and exploring.
- Target High-Performers: Focus on marketing channels that bring qualified leads.
Tip: In Google Analytics 4, explore the “Path Exploration” report. It shows your users’ actions working forward from a specific event or page.

2. Scroll Depth: Ensure Your Message Gets Seen
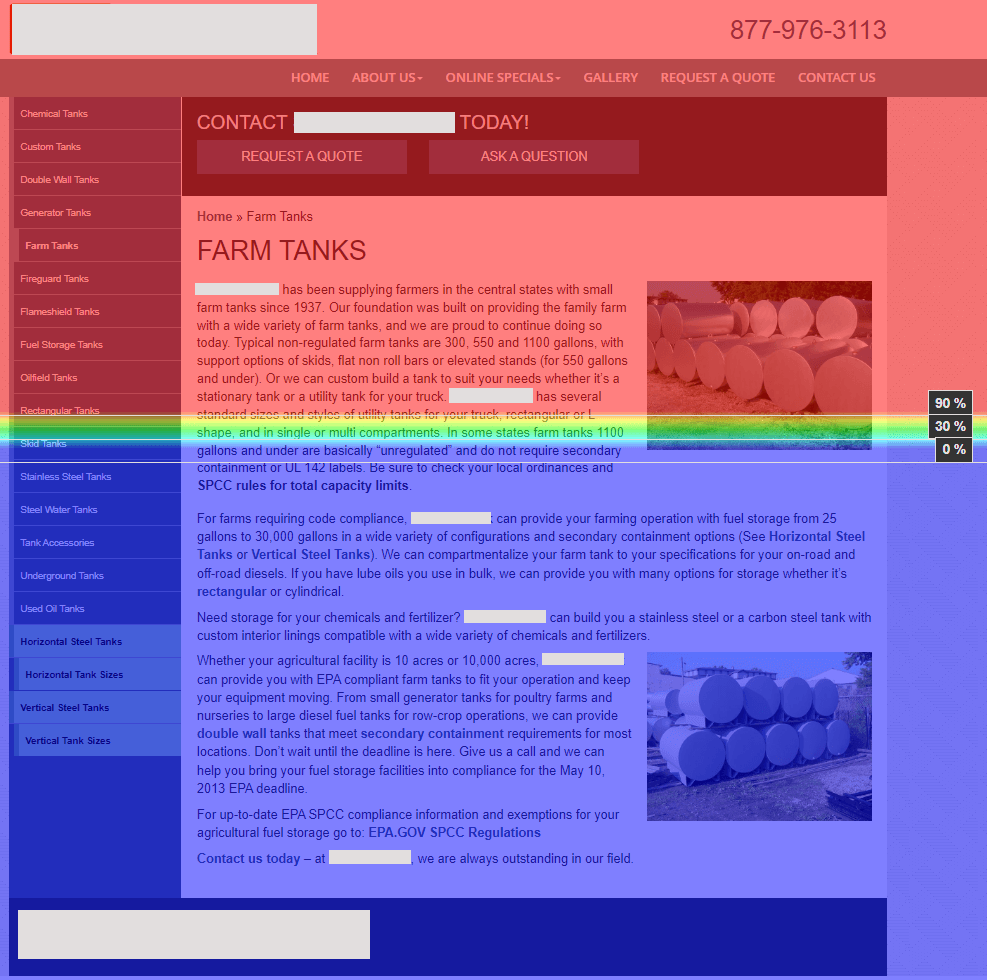
Are you hiding an important Call to Action (CTA) button where viewers have to scroll to see it? Scroll Depth reports reveal how much of your pages are actually being seen, and if your most important information is being missed.
A Scroll Depth Report reveals significant details including:
- Scroll Depth Percentage: How far down the page do visitors typically scroll?
- Heatmaps: Visually track visitor engagement across the entire page.
This report helps you understand:
- Visibility of Key Information: Do visitors see your calls-to-action (CTAs)? Is essential information “above the fold” or seen without scrolling?
- Engagement Depth: On average, how far down the page do visitors scroll? Are they missing your key selling points?
Tip: Create a custom Scroll Report in Google Analytics 4. Consider using Mouseflow for heatmaps.

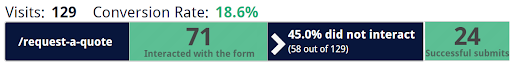
3. Form Fallouts: Why Aren’t Visitors Converting?
Lead generation forms are one of the most reliable types of feedback you can get from your website. Unfortunately, a high number of form page visitors doesn’t necessarily translate to leads. This report sheds light on:
- Form Completion Rates: What percentage of visitors actually submit forms after landing on them?
- Drop-off Points: Are your forms too complex or lengthy? Pinpoint where visitors abandon partially completed forms.
Using this data, you can:
- Simplify forms: Find ways to reduce fields, and prioritize user experience.
- Target Drop-off Points: Address specific areas that seem to be hindering form completion.
Tip: Turn form page visitors into leads! Analyze form completion rates and identify drop-off points. Simplify forms, reduce unnecessary fields, and ensure CTAs stand out.
By implementing these 3 actionable reports, you’ll gain valuable insights to optimize your website for immediate results. Make the most of your website’s full potential and watch your lead generation grow!